

For fifteen years, digital marketers have lived by one promise: you can track every click, so you can prove what works. That promise is fraying. Privacy rules limit tracking, browsers restrict cookies, platforms grade their own homework, and a growing share of discovery now happens inside AI assistants and answer boxes that never send a click. At Google I/O 2026, Google even described always-on AI agents that monitor topics for people and push updates without generating a trackable session. When customers can be influenced without a visit, last-click reports stop telling the truth.
Marketing mix modelling, usually shortened to MMM, is the oldest answer to this problem, and it is having a comeback. It estimates what each channel contributes by studying aggregated patterns in spend and sales over time, with no individual tracking required. Google’s open-source Meridian framework and its no-code Scenario Planner have made the approach far more accessible. This guide explains what MMM is, how Meridian works, what data you need, how to run a project step by step, how to read the results, and how to decide whether it is worth doing for your business at all.
Quick answer: Marketing mix modelling uses statistics to estimate how much each marketing channel and outside factor, such as seasonality, pricing and promotions, contributes to sales, using aggregated weekly data instead of user-level tracking. Google Meridian is a free, open-source Bayesian MMM framework, made globally available in January 2025, and its Scenario Planner, announced in February 2026, lets non-technical teams test budget scenarios. You typically need two to three years of weekly data across several channels, plus experiments to calibrate the model. Used well, it shows true marginal returns and diminishing returns, so you can move budget with more confidence than last-click reports allow.
What is marketing mix modelling?
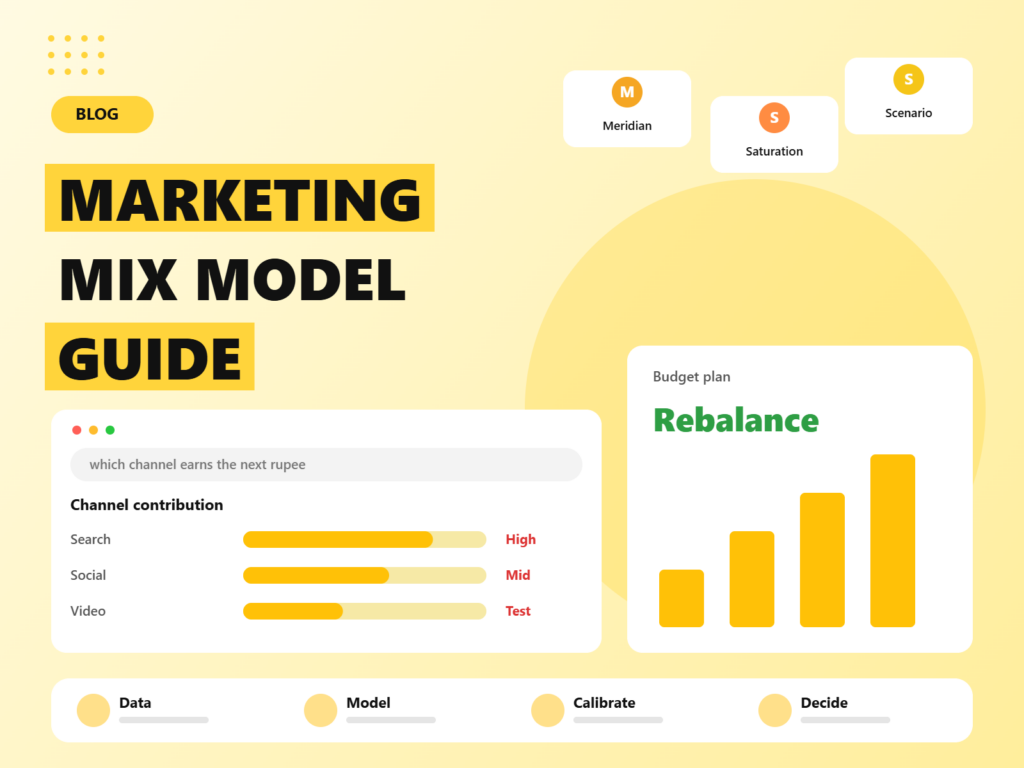
Marketing mix modelling is a statistical method that explains changes in a business outcome, usually sales or conversions, using changes in marketing activity and other influences. Imagine your weekly revenue over three years. Some of the ups and downs come from marketing: a TV burst, a search budget increase, an influencer campaign. Some come from things you did not control, such as holidays, weather, competitor sales or a change in the economy. An MMM tries to separate these effects, so you can say, for example, that paid social drove roughly a certain share of sales last year, and that the next rupee on search will return less than the last.
Three features make MMM attractive right now:
- It does not need user-level data. It works with totals by week and channel, so it is naturally compatible with privacy rules and cookie loss.
- It sees every channel on the same basis. Platform dashboards each claim credit for the same sale. An MMM puts search, social, video, email, offline and promotions into one model.
- It captures what clicks miss. Brand-building activity, awareness campaigns and AI-driven influence often work without a click, so click-based models undervalue them.
MMM versus attribution versus incrementality tests
These three methods answer different questions, and the best measurement setups use all of them.
- Multi-touch or last-click attribution traces individual journeys through your analytics. It is fast and granular, but it depends on tracking that is incomplete and it favours the channels closest to the sale.
- Incrementality experiments, such as geo holdouts or platform lift studies, test the causal effect of one channel by switching it off or reducing it in some places and comparing outcomes. They are close to proof, but each test answers only one question at one time.
- Marketing mix modelling estimates the contribution of all channels together, over time, and models diminishing returns. It is strategic, not tactical, and it is only as good as its data and assumptions.
A practical approach is to triangulate. Use attribution for day-to-day optimisation, experiments to test specific doubts, and MMM to set the budget across channels. Even better, use experiment results to calibrate the MMM, which we cover below. For a platform-level example of why this matters, see our guide to Meta Ads in 2026, where platform ROAS and business-level results can diverge, and our explanation of how to compare ChatGPT ads and Google Ads fairly.
Why MMM is back in 2026
Several forces are pushing teams toward modelling:
- Signal loss. Cookie restrictions and tracking limits keep eroding user-level data. Even though Google has softened its stance on third-party cookies, as we explained in our piece on the cookie reversal, you cannot build a measurement strategy on browser policy staying friendly.
- AI-driven discovery. More research happens inside assistants and AI search. Influence without a visit leaves no click to attribute. We looked at the scale of this in our analysis of zero-click searches and show how to measure what you can in our guide to tracking AI referral traffic in GA4.
- Platform automation. As Google and Meta automate targeting and bidding, advertisers see fewer levers and more black boxes. Independent measurement becomes a necessary counterweight.
- Better tools. Open-source frameworks and no-code interfaces have lowered the barrier to entry. Google has also been positioning Meridian inside its analytics offering, with reports that Google Analytics 360 is being rebuilt as a cross-channel measurement hub that brings in data from platforms such as TikTok, Pinterest and Snap.
What is Google Meridian?
Meridian is Google’s open-source marketing mix modelling framework. Google unveiled it in 2024 after the earlier project known as LightweightMMM, tested it with a range of brands, and made it globally available in January 2025. It is built in Python and uses Bayesian statistics, which means it expresses results as ranges of likely values, not single numbers, and lets you encode prior knowledge, for example from experiments, directly into the model.
In February 2026, Google announced the Scenario Planner, a no-code interface that sits on top of Meridian. It lets marketers try different budget allocations across channels and see estimated outcomes without writing code. That moves MMM from a backward-looking report to a forward-looking planning tool. The model itself still needs careful data preparation, configuration and validation, so the planner is a way to use results, not a way to skip the hard work of building a sound model.
What Meridian can model
- Media variables: paid media spend by channel, and where available reach and frequency data, which helps with channels such as video.
- Organic and non-media variables: pricing, promotions, distribution changes, seasonality, macroeconomic indicators and other drivers.
- Diminishing returns: saturation curves that show how returns flatten as spend rises.
- Carry-over effects: the lagged impact of advertising, sometimes called adstock.
- Experiment calibration: a way to incorporate results from geo experiments so the model is anchored to causal evidence.
- Outputs: channel contribution, return on investment, marginal return on the next unit of spend, and budget optimisation scenarios.
Other options
Meridian is not the only choice. Meta’s open-source Robyn and the PyMC-Marketing library are popular alternatives, and a number of commercial vendors offer managed MMM. The right choice depends on your team’s technical skills, budget and appetite for owning the process. The concepts below apply to all of them.
What data do you need?
Data is the main constraint on any MMM. Practitioners generally recommend the following, although exact needs depend on how many channels you want to measure.
- History: at least two years of weekly data if you model by geography, and about three years of weekly data for a national model. Monthly data needs a longer history, usually three years or more.
- Outcome: weekly sales, orders, revenue or conversions, ideally by region if you have multiple regions. Use a business outcome you trust, such as revenue from your order system, not a platform-reported figure.
- Media spend by channel and week: search, social, video, display, affiliates, influencers, TV, radio, print and out-of-home. Include impressions or reach where possible.
- Controls: prices, discounts, promotions, product launches, stock-outs, distribution changes, holidays and seasonality, competitor activity if available, and relevant economic indicators.
- Organic channels: email sends, organic social posts, and major PR or content moments, since these influence outcomes too.
- Experiment results: any geo tests or lift studies, with dates, regions and measured effects, for calibration.
A caution on quantity: if you try to estimate the effect of a dozen channels from two years of weekly data, you have only around a hundred observations and many effects to estimate. The model may run and produce good-looking charts while the underlying estimates are very uncertain. Fewer, well-defined channels and longer histories give more trustworthy answers.
How to run an MMM project, step by step
Step 1: Define the business question
Start with the decisions you want to improve. Typical questions include how to split next year’s budget between search, social and video, whether brand spend is paying back, what happens if you cut a channel by 20 percent, and how much to invest in a new market. Write the questions down. They shape the data, the level of detail and the output.
Step 2: Decide the structure
Choose the time grain, usually weekly, the geographic level, national or by region, and the list of channels. Group small channels together so each modelled channel has enough spend and variation to measure. Avoid modelling at campaign level, since the carry-over memory of individual campaigns is too short and data too thin, and stay at the channel or sub-channel level instead.
Step 3: Collect and clean the data
Build a single table with one row per week, or per week and region, with columns for the outcome, spend and impressions by channel, and controls. Check for gaps, duplicates, changes in definitions, tracking outages and outliers. Document every adjustment. This step usually takes the longest and has the biggest effect on quality.
Step 4: Set up and configure the model
Install Meridian, which requires a supported Python environment and, for speed, a GPU. Configure your media and control variables, and set priors. Priors express what you believe before seeing the data, for example that advertising effects are positive and that returns diminish. Where you have experiment results, use them to inform priors for the relevant channels. Seek help from someone comfortable with Bayesian modelling, or an agency, if you do not have that skill in-house.
Step 5: Run and check diagnostics
After fitting the model, check that it has converged and fits the data. Look at how well predicted sales track actual sales, including on data held back from fitting. Review uncertainty intervals, because wide ranges mean the data cannot pin down that effect. Test whether results change sharply when you alter reasonable assumptions. A model that gives wildly different answers under small changes is not ready for decisions.
Step 6: Calibrate with experiments
Compare the model’s estimate for a channel with what your experiments showed. If a geo test said a channel’s return was modest and the model says it is spectacular, investigate. Calibrating with experiment results is how you move from correlation toward causation, and it is the most valuable single upgrade you can give an MMM.
Step 7: Read the outputs properly
Focus on three things. First, contribution: how much of sales each channel and non-media factor explains. Second, return on investment, which averages across all spend, and marginal return, which tells you what the next unit of spend would earn. Third, saturation: where each channel’s curve flattens. Decisions should lean on marginal return and uncertainty ranges, not on a single headline number.
Step 8: Plan budget scenarios
Use Meridian’s optimisation or the Scenario Planner to compare allocations, subject to real-world limits such as minimum commitments, capacity, and how fast you can scale. Treat the best allocation as a hypothesis to test, not a command. Move a portion of budget, measure with an experiment, and feed the result back into the model.
Step 9: Refresh regularly
An MMM is a living model. Update it with new data at least quarterly, or monthly for fast-changing businesses, and re-check assumptions when something big changes, such as a new channel, a pricing change or a major platform update.
A worked example: reading a simple MMM result
The numbers below are invented to show the thinking, not to suggest benchmarks. Imagine an online retailer that spends on search, paid social, video and influencers, and has three years of weekly data. The model returns the following picture for last year:
- Search: average return looks strong, but the saturation curve shows it has flattened. The marginal return on the next unit of spend is low, because much of search demand is created by other channels and the retailer already bids on most relevant terms.
- Paid social: average return is middling, but the curve is still steep, which suggests there is room to spend more before returns flatten.
- Video: the estimate is wide, from slightly negative to very positive, because spend was low and varied little. The honest conclusion is that the data cannot tell.
- Influencers: a positive contribution that matches a geo test the team ran last spring, which raises confidence in this estimate.
- Promotions and seasonality: together they explain a larger share of sales than any single media channel.
What would a sensible team do? Not shift everything to social. They might move a modest slice of search budget to paid social, run a geo experiment that varies video spend deliberately so the next model can learn from it, keep influencers steady, and plan promotions with a clearer view of how much lift they really deliver. Then they feed the experiment results back into the next model run. Notice how every decision is a step, paired with a test, instead of a leap.
How MMM treats brand, AI discovery and non-click influence
One of the strongest arguments for MMM is that it can pick up effects that never produce a click. When an assistant recommends your brand or a video builds familiarity, the visible result is often an uptick in branded search or direct visits a few days later. An MMM can include proxies for these influences, such as branded search volume, direct traffic or share of voice, as modelled drivers or as outcomes. Be careful here. Branded search is often a result of advertising, not a cause of sales, so adding it as a driver can distort the picture. Many practitioners treat it as a mediator or model it as a separate outcome, and some leave it out of the main model. If you plan to bring AI-related signals into your model, discuss the design with a statistician first.
Questions to ask an agency or vendor before you hire
- How many years of data do you need, and at what level of detail?
- Will you use our experiment results to calibrate the model, and how?
- Which priors will you set, and can we see and challenge them?
- How will you report uncertainty, and will you tell us when the data cannot answer a question?
- Do we own the model, the code and the data pipeline, or are they locked into your platform?
- How often will the model be refreshed, and what does that cost?
- How will you translate results into a media plan, and how will we test your recommendations?
- Can you show a past project where the model changed a decision, and what happened afterwards?
A good partner will welcome these questions. A vendor who promises certainty, or who cannot explain the model in plain language, deserves caution.
How to read MMM results without being misled
- Look at ranges, not points. A channel with a return estimate between 0.5 and 4 is telling you the data does not know. Do not bet the budget on its midpoint.
- Remember what the model cannot see. Unrecorded factors, such as a competitor’s big sale, can be mistaken for marketing effects if not included.
- Beware correlated channels. If two channels always spike together, such as search and TV in the same burst, the model struggles to separate them. Planned variation in spend, ideally through experiments, solves this.
- Separate short-term from long-term effects. Brand-building pays back slowly. Make sure your model and your time horizon are compatible with the question.
- Compare with common sense. If the model says your best-known channel has no effect, check data and assumptions before acting.
- Keep a decision log. Note what the model said, what you changed and what happened, so the model earns trust or gets fixed.
Is MMM right for your business?
MMM is powerful, but it is not for everyone. Consider it if you spend meaningfully across several channels, have at least two to three years of consistent data, face real questions about how to split budget, and can commit people and time to build, validate and maintain a model or hire a specialist.
It is probably premature if you rely on one or two channels, if your history is short or your tracking changed repeatedly, or if your budget is small. In that case, simpler tools may give you most of the benefit:
- Geo or time-based holdout tests to measure the effect of your biggest channel.
- Blended metrics such as marketing efficiency ratio, which divides total revenue by total marketing spend, tracked weekly.
- Platform lift studies from Google and Meta, understanding that they are run by the platforms themselves.
- A brand-search and direct-traffic trend as a rough read on awareness effects, using tools covered in our piece on automating SEO reporting with Search Console and BigQuery.
- Customer surveys asking how people heard about you, which often reveal channels that clicks never show.
Common mistakes to avoid
- Treating the model as an oracle. It is an estimate with uncertainty. Use it to inform, not dictate.
- Too many channels for too little data. Fewer, broader groupings give steadier results.
- Skipping calibration. Without experiments, the model can confuse correlation with cause.
- Dirty or inconsistent data. Definition changes and tracking gaps quietly poison results.
- Modelling at campaign level. The carry-over structure does not suit it.
- Building once and forgetting. Markets change. Refresh on a schedule.
- Ignoring organic and non-media factors. Pricing, promotions and seasonality often explain more than media does.
- Failing to act. A model that never changes a budget decision is a cost, not an investment.
A 90-day roadmap to your first MMM
Days 1 to 30: scope and data. Agree the business questions, list channels and controls, find three years of weekly data, and fix gaps. Inventory past experiments. Decide who owns the project.
Days 31 to 60: build and validate. Set up Meridian or your chosen tool, configure variables and priors, run the model, check diagnostics, calibrate against experiments and review results with a sceptical eye.
Days 61 to 90: decide and test. Run budget scenarios, pick one or two changes to test through a geo experiment, brief leadership with ranges and caveats, and schedule the first refresh.
Measurement is moving from tracking people to modelling outcomes. Brands that build a sound, calibrated MMM now will make better budget decisions as signals fade and AI changes how customers find them. If you would like help with data preparation, experiment design or turning model output into a media plan, our PPC and paid media team and AI SEO specialists work with analytics and finance teams to build measurement that stands up to scrutiny.
Frequently asked questions
What is marketing mix modelling?
Marketing mix modelling is a statistical method that estimates how much each marketing channel and external factor, such as seasonality or pricing, contributes to sales. It uses aggregated data over time, not individual user tracking, so it works even when cookies and identifiers are limited.
What is Google Meridian?
How much data do I need for MMM?
Is MMM better than attribution?
Can small businesses use MMM?
How often should an MMM be updated?
We help you prepare the data, design experiments and turn marketing mix modelling into budget decisions you can defend.

Riya Bhardwaj
Leading content and growth initiatives with a focus on search visibility, audience engagement, and measurable business outcomes. Specialised in SEO, Generative Engine Optimization (GEO), AI search optimisation, and performance-driven content marketing. Passionate about transforming market insights into scalable content strategies that strengthen brand authority and drive sustainable digital growth.